
Polyurethanes were invented in 1937 by Otto Bayer and his co-workers. Flexible PU foams were developed and used in car seats in the early 1950s. In the 1990s, the first low-emission foams were developed and, due to emanations control, were extended to subsurface materials used, such as seat cushions. Raw material suppliers were asked to explore the sources of the emanations and work with OEMs to reduce their overall quantity. At that time, silicone surfactants played a key role in low emissions. A general overview on the emissions and the analytical methods used to analyze PU foam emissions was published in 2018, but it focused mainly on emissions under well-established methods such as VDA 278, which is one of the standard European methods. As other markets such as the Asia-Pacific economic zone may have different requirements and quality standards when emissions are considered, we summarize in this paper the main volatile components currently monitored in this region and how they are analyzed. We also discuss analytical data regarding the contribution of silicone surfactants to emissions and how they can be improved to meet customer requirements.
- Introduction
Automotive market leading OEMs are pursuing a reduction in emission from their plastic
components following the trend of customers worldwide looking for less emission-intensive environmental conditions. Low volatile organic components (VOC) are thus a requirement of the industry and different methods have been used worldwide for the material testing. Some requirements are generally recognized in some countries or economic areas, like the VDA (Verband der Automobilindustrie) methods in Europe, while other methods are specific for each car producer and they have some differences that make it difficult to obtain standardized methods and comparable values.
In the Asia Pacific economic zone, the control of the emissions of very volatile compounds, specifically a group of aldehydes and aromatic substances, besides the odor control on plastic components has taken a major importance in the last years.
The main concern is a list of very volatile substances, being the most analyzed ones summarized in table 1.
| Substance | formula | Structure | CAS No | Mw (g/mol) | Boiling point (ºC) | Toxicity (*) |
| Benzene | C6H6 |  |
71-43-2 | 78.11 | 80 | 3.3 g/kg |
| Toluene | C7H8 |  |
108-88-3 | 92.14 | 111 | 7.53 g/kg |
| Ethylbenzene | C8H10 |  |
100-414 | 106.17 | 136 | 5.46 g/kg |
| Xylene | C8H10 |  |
1330-20-7 | 106.17 | 137-140 | 4.3 g/kg |
| Styrene | C8H8 |  |
100-42-5 | 104.15 | 145 | 4.94 g/kg |
| Formaldehyde | CH2O |  |
50-00-0 | 30.03 | 97(37% solution)
19.5 (pure) |
0.5 g/kg |
| Acetaldehyde | C2H4O |  |
75-07-0 | 44.05 | 65-82 | 1.93 g/kg |
| Acrolein | C3H4O |  |
107-02-8 | 56.06 | 53 | 0.046 g/kg |
| Propionaldehyde | C3H6O |  |
123-38-6 | 58.08 | 48 | 1.4 g/kg |
Table 1: Properties of volatile substances (considered as VOC) analyzed in Asia-Pacific economic zone. (*) LD50 orally in rats.
The list of volatile substances includes a variety of aromatic structures, three aldehydes and acrolein. They are characterized by a low boiling point (below 150 °C), and regarding its toxicity (based on LD50 (lethal dose to kill 50% of test population) data), the values are quite variable, ranging from dangerous substances like acrolein and formaldehyde to substances with less toxicity like toluene.
Some of the above substances cause also odor. This is a general complaint of consumers when they get in close contact with goods that contain plastic parts, especially when they are recently produced. Odor is a very sensitive feeling and it has been regarded as extremely difficult to quantitatively ascertain odors through equipment analysis. Many chemicals have odor, and so generally speaking, odor components are said to be substances with a molecular weight of around 20 – 400 g/mol.
As an example, the following chemicals analyzed as odor substances under the specifications of some methods (according to Hyundai-Kia MS 300-55):
- Butyl acetate
- Acetaldehyde
- Propionaldehyde
- Butylaldehyde
- Valeraldehyde
- Nonyladehyde
- Decylaldehyde
- Methyl ethyl ketone
- Methyl iso-butyl ketone
- Trimethylamine
- VOC emissions – Study background
The range of additives for HR molded and slabstock foam, Concentrol STB PU-12XX
PF was released more than ten years ago to introduce phthalate free versions of the
well stabilized Concentrol STB PU-12XX range of surfactants, maintaining their performance and recognized technical capabilities.
With this new range of additives, the emissions under methods like VDA278 were very low, especially in some of the last references introduced into the market. But the emissions of certain aldehydes were found to be not as low as some customers require.
More recently and considering the needs found in the Asia-Pacific economic zone regarding emissions and odor, a new family of additives has been developed under the tradename Concentrol STB PU-12XX PFJ.
The new references had shown excellent emissions results, under well-established methods like VDA-278 and also regarding aldehydes, aromatic substances and odor, compared with existing surfactants. The materials had been evaluated in different countries and using different methods, showing in all cases improved values compared with materials made with Concentrol STB PU-12XX PF. It also showed, in most cases, improved values of emissions compared with other well-established references available on the market.
- VOC methods
Gaseous VOC constituents emitted from test samples are captured and identified depending on the chosen method. Some of the most used methods for the analysis of aldehydes and aromatic substances are summarized in table 2.
| Specification | Test Method | VOC Test Description |
| Hyundai-Kia | MS300-55 | 3L bag – DNPH & VOC analysis |
| Toyota | TSM 0508G | Various size bag – DNPH & VOC analysis – 1 part & 1 background |
| Nissan | NES M0402 | Method #2 – 10L bag – DNPH & VOC analysis – 1 part & 1 background |
| Nissan | NES M0402 | Method #1 – 2000L bag – DNPH & VOC analysis – 1 part & 1 background |
| Honda | DWG 0094Z SNA 0000 | 3-day bag prep – DNPH & VOC analysis |
| Mazda | MES CF 080 B | 20L pot – DNPH & VOC analysis – blank & test part |
Table 2: List of methods for the analysis of aromatic substances and aldehydes.
- VOC analysis of silicone surfactant. Results
The first analysis was conducted directly on the sample of each silicone surfactant. So the substances analyzed were part of the stabilizer, were byproducts of the reaction or were non-intentionally added substances (NIAS), coming from the process or the raw materials used.
Regarding the aldehydes, it is believed that they are degradation products (mainly from oxidation processes), most of them coming from the polyether part of the surfactant. The siloxane backbone is not believed to be a major constituent of aldehyde emissions, nor of aromatic ones. Usually, the VOC emissions of the siloxane backbone are low molecular weight linear siloxanes and cyclic structures (Dx), that are usually well analyzed by thermo desorption methods like VDA278.
The aromatic substances can be present because of the chemical process (residues of the solvents used in the reaction) or they can be NIAS. The chemical process depends on each producer, and the preparation of the surfactants without the use of any aromatic component is thus a clear advantage. At Concentrol, the preparation of the stabilizers is always done in a free of aromatic components synthesis.
4.1 Emissions of silicone surfactants. Comparison between PF and new PFJ families
The method used was TSM 0508G (Toyota). The emissions of PF and PFJ surfactants were directly measured from the sample. The results of seven VOC components are summarized and illustrated in Figure 2 and Table 3.
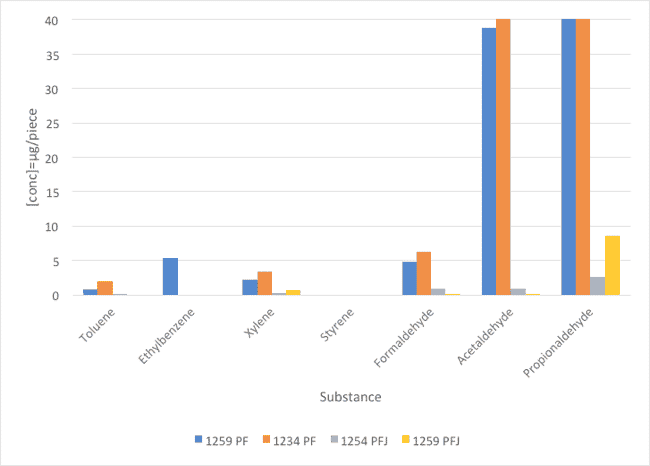
Fig. 1 : Comparison of VOC values between PF and PFJ families (concentration in μg/piece).
| Substance | STB PU-1259 PF | STB PU-1234 PF | STB PU-1254 PFJ | STB PU-1259 PFJ |
| Toluene | 0,74 | 1,86 | 0,13 | 0 |
| Ethylbenzene | 5,25 | 0 | 0 | 0 |
| Xylene | 2,12 | 3,34 | 0,21 | 0,71 |
| Styrene | 0 | 0 | 0 | 0 |
| Formaldehyde | 4,8 | 6,21 | 0.98 | 0,06 |
| Acetaldehyde | 38,8 | 94,7 | 0.98 | 0,05 |
| Propionaldehyde | 1726 | 628 | 2,58 | 8,64 |
Table 3: Comparison of VOC values between PF and PFJ families (concentration in μg/piece).
The new PFJ family highly improves the emissions of aldehydes compared with the values obtained with PF family of surfactants. Regarding the aromatic emissions, all references gave comparable results.
4.2 Emissions of silicone surfactants: Comparison between new PFJ family and comparative silicone surfactants
The method used was TSM 0508G (Toyota). The emissions of PFJ families as well as silicone surfactants A-F were directly measured from the samples. The results of the seven VOC components are summarized and illustrated in Figure 2 and Table 4.
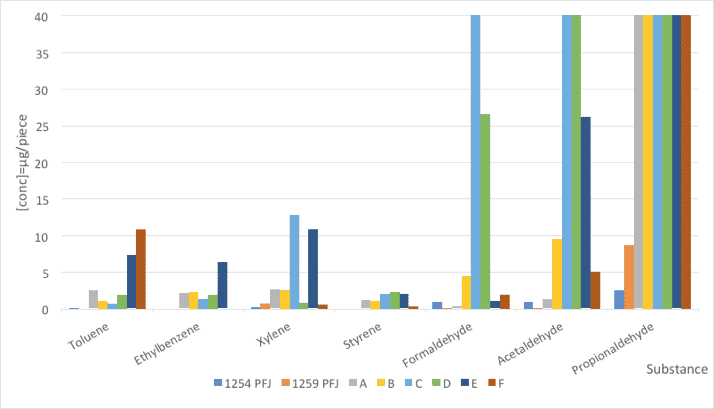
Fig. 2: Comparison of VOC emissions from foam samples made with PFJ references and a standard stabilizer (concentration in μg/m3).
| Substance | STB PU-1254 PFJ | STB PU-1259 PFJ | A | B | C | D | E | F |
| Toluene | 0,13 | 0 | 2,45 | 1,1 | 0,71 | 1,83 | 7,23 | 10,8 |
| Ethylbenzene | 0 | 0 | 2,15 | 2,18 | 1,38 | 1,79 | 6,34 | 0 |
| Xylene | 0,21 | 0,71 | 2,54 | 2,48 | 12,8 | 0,62 | 10,81 | 0,54 |
| Styrene | 0 | 0 | 1,18 | 1,06 | 1,91 | 2,24 | 1,92 | 0,36 |
| Formaldehyde | 0.98 | 0,06 | 0,23 | 4,43 | 41,2 | 26,5 | 0,96 | 1,92 |
| Acetaldehyde | 0.98 | 0,05 | 1,22 | 9,62 | 915 | 3,56 | 26 | 5 |
| Propionaldehyde | 2,58 | 8,64 | 244 | 4465 | 2301 | 4263 | 3122 | 164 |
Table 4: Comparison of VOC emissions from foam samples made with PFJ references and a standard stabilizer (concentration in μg/m3).
The new PFJ family offers very low emissions in all substances analyzed. Especially regarding the aldehydes, the obtained values are clearly better compared with comparative silicone surfactants. In all cases, propionaldehyde is the main source of aldehyde-type emissions.
- VOC and odor analysis of polyurethane foams
Besides the results of emissions directly measured from the silicone surfactant seen in the previous analysis, the values of the emissions of PU foam samples were also investigated. In the first experiment (5.1) three PFJ references were compared with each other, and also with a reference surfactant (sample G), analyzing both the VOC emissions and a list of ten substances that are known to be odor sources. The second experiment (5.2) compares the emissions of silicone STB PU-1259 PFJ (two dosages) with those found using two standard stabilizers.
5.1 Comparison between three PFJ references and one standard surfactant
Four foams were prepared using three PFJ stabilizers and a reference foam using a standard surfactant. The foams were analyzed for the VOC emissions (eight components) and for the odor emissions (ten components). Figure 3 and Table 5 illustrate the results of the eight VOC components, and Figure 4 and Table 6 illustrate the results of ten odor components.
The method used was MS 300-55 (Hyundai-Kia). For the sample preparation 1 g of foam sample was introduced in a plastic bag with a volume of 3L, nitrogen was introduced filling the complete 3L volume. The sample bag was heated to 65 °C for 2 h. A DPNH cartridge and Tenax tube was used for the adsorption of VOC. The analysis was conducted on chromatographic equipment, HPLC and MS/GC.
Results of 8 VOC components:
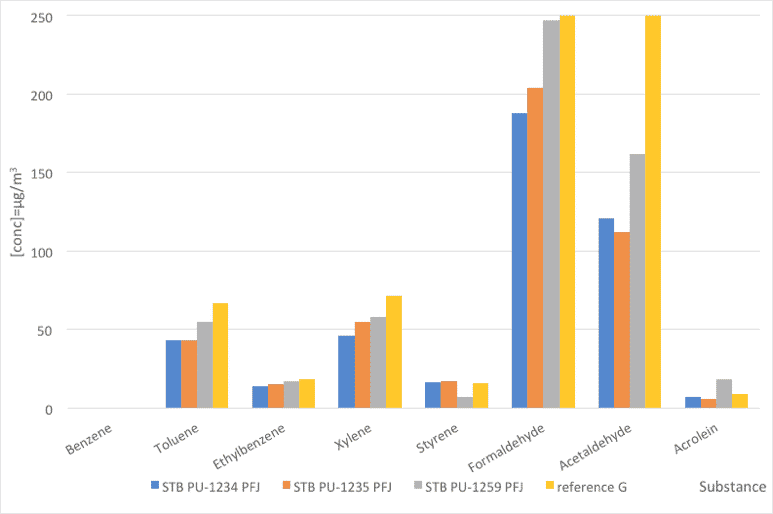
Fig. 3: Foam emissions (VOC). Comparative values between PFJ references and a reference stabilizer.
| Substance | STB PU-1234 PFJ | STB PU-1235 PFJ | STB PU-1259 PFJ | reference G |
| Benzene | 0 | 0 | 0 | 0 |
| Toluene | 43 | 43 | 55 | 67 |
| Ethylbenzene | 14 | 15 | 17 | 18 |
| Xylene | 46 | 55 | 58 | 72 |
| Styrene | 16 | 17 | 7 | 16 |
| Formaldehyde | 188 | 204 | 247 | 328 |
| Acetaldehyde | 121 | 112 | 162 | 1218 |
| Acrolein | 7 | 6 | 18 | 9 |
Table 5: Foam emissions (VOC). Comparative values between PFJ references and a reference stabilizer.
Results of 10 odor components:
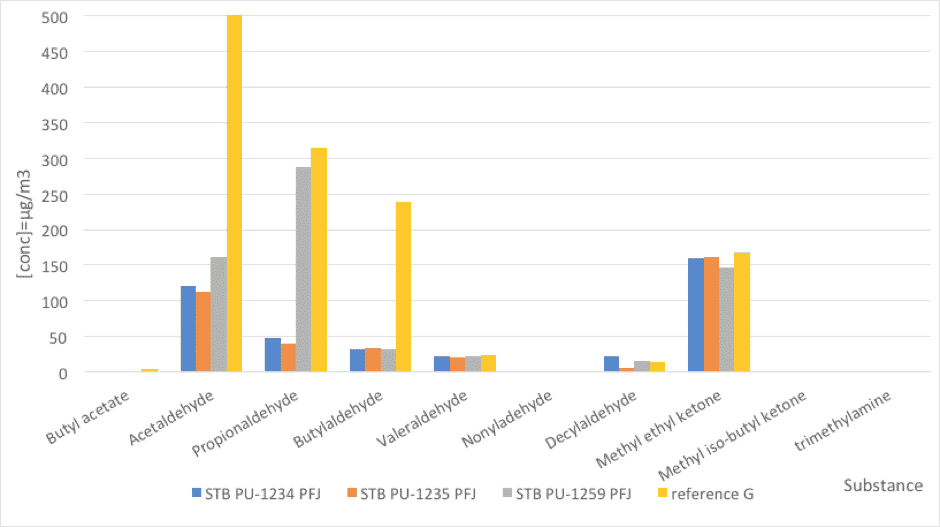
Fig. 4: Foam emissions (odor). Comparative values between PFJ references and a reference stabilizer (nd=not detected).
| Substance | STB PU-1234 PFJ | STB PU-1235 PFJ | STB PU-1259 PFJ | reference G |
| Butyl acetate | nd | nd | nd | 4 |
| Acetaldehyde | 121 | 112 | 162 | 1218 |
| Propionaldehyde | 48 | 40 | 287 | 315 |
| Butylaldehyde | 31 | 34 | 32 | 239 |
| Valeraldehyde | 22 | 21 | 22 | 24 |
| Nonyladehyde | nd | nd | nd | nd |
| Decylaldehyde | 22 | 5 | 15 | 13 |
| Methyl ethyl ketone | 160 | 161 | 147 | 168 |
| Methyl iso-butyl ketone | nd | nd | nd | nd |
| trimethylamine | nd | nd | nd | nd |
Table 6: Foam emissions (odor). Comparative values between PFJ references and a reference stabilizer (nd=not detected).
5.1 Comparison between STB PU-1259 PFJ (2 dosages) and 2 reference surfactants
Two foam samples were prepared using STB PU-1259 PFJ, at dosages 0.90 pphp and 1.20 pphp and two other foams were prepared using standard surfactants at a dosage of 1.20 pphp. The first objective was to analyze if the VOC emissions have a direct relation with the surfactant dosage. The second objective was to carry out a comparison between STB PU-1259 PFJ, a recommended stabilizer for TDI based foams and two well known standard stabilizers from the market. The foams were analyzed for the VOC emissions
(seven components). The method used was TSM 0508 G (Toyota) and the results are summarized and illustrated in Figure 5 and Table 7.
Regarding the first objective, the results show that increasing the dosage of the surfactant also increases the VOC emissions, although the increase is not very high. This can be explained due to a low VOC contribution of STB PU-1259 PFJ. Although the substance is used at higher amounts, the final contribution to the total VOC emissions is low.
The comparison of STB PU-1259 PFJ with the two standard stabilizers shows that the emissions are similar, except for propionaldehyde, were STB PU-1259 PFJ and reference H offer the best result compared to reference I.
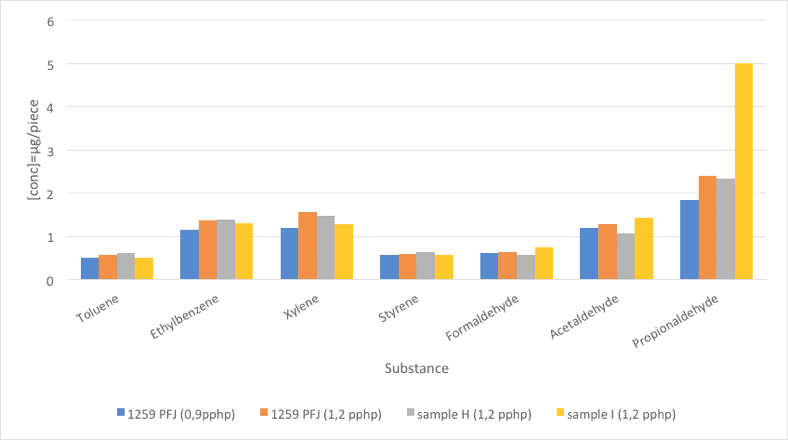
Fig. 5: Foam emissions (VOC). Comparative values between STB PU-1259 PFJ (2 dosages) and 2 reference surfactants.
| Substance | STB PU-1259 PFJ | STB PU-1259 PFJ | Reference H | Reference I |
| Dosage | 0,90 pphp | 1,20 pphp | ||
| Toluene | 0,51 | 0,57 | 0,62 | 0,52 |
| Ethylbenzene | 1,16 | 1,38 | 1,39 | 1,3 |
| Xylene | 1,21 | 1,56 | 1,49 | 1,28 |
| Styrene | 0,57 | 0,59 | 0,64 | 0,58 |
| Formaldehyde | 0,61 | 0,65 | 0,58 | 0,75 |
| Acetaldehyde | 1,19 | 1,28 | 1,08 | 1,43 |
| Propionaldehyde | 1,84 | 2,4 | 2,35 | 5,01 |
Table 7: Foam emissions (VOC). Comparative values between STB PU-1259 PFJ (2 dosages) and 2 reference surfactats.
- Conclusions
Strong efforts had been taken in the last years to reduce the emissions of volatile substances of plastic components, being flexible PU foams one of them. The automotive industry has been focused in the reduction of VOC and odor from the interior parts of the cars. Considering this, the request for new additives with lower volatile components is still a major need.
While some existing references fulfill the requirement of phthalate free, low VOC stabilizers (under thermal desorption methods like VDA278), the need for low aldehyde, aromatic and odor foams was not fully resolved with the existing range of references.
New stabilizers had been designed and they had been tested in commercial PU foams in order to fulfill the requirements found in some countries from the Asia-Pacific area, regarding aldehyde, aromatics and odor components. Some of the new references of Concentrol STB PU-12xx PFJ offer an excellent overall performance and very low emission profile.